
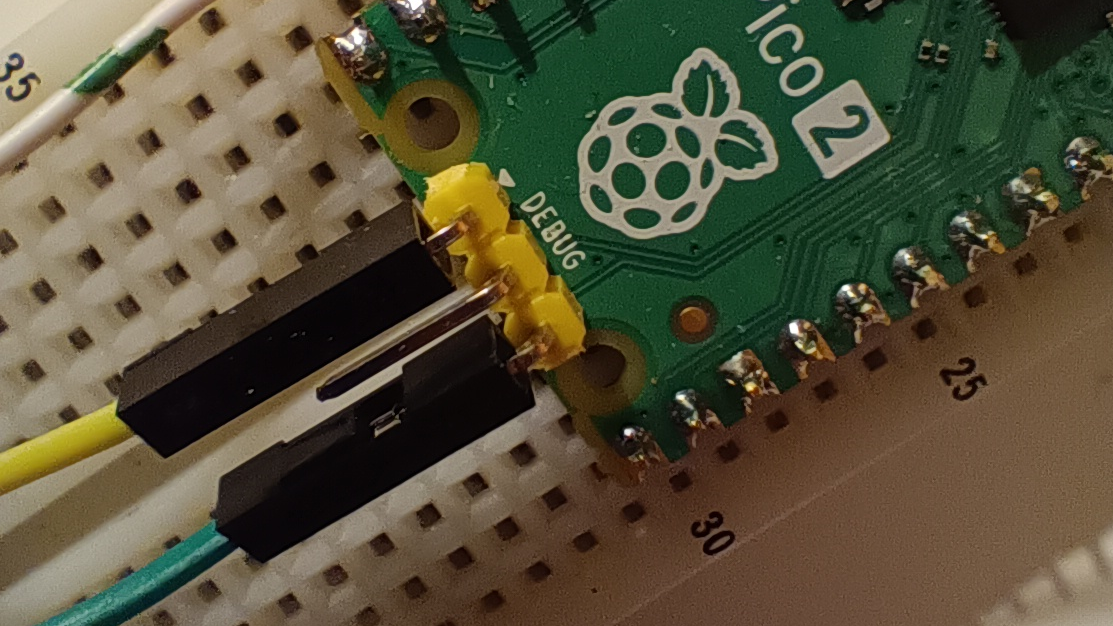
The RP2040 and RP2350 have dedicated debug pins. These pins are accessible on the development boards. This interface can be used to watch the processor working in real time and identify the location where a program gets stuck.
To get access to all details, an in-circuit debugger, for example, the official Raspberry Pi Debug Probe, can be used. This probe is based on a Pico, and there are also instructions available on how to convert any Pico development board into a debugger.
When I tried to get the debugger to work for the first time, I found partial instructions scattered around the internet, tried different approaches, and ran into several deadends. Therefore, I wrote down my path, which led me ultimately to a working debugger. This path can outdate quite fast and also depends on the specific computer and software setup.
My programming setup
I’m using Kubuntu 24.04.4 and have previously installed the SDK according to the instructions of the 🌐Getting Started with Raspberry Pi Pico-series document.
I use Visual Studio Code. The official Raspberry Pi Pico VS Code extension and other essential extensions like CMake are installed.
Prepare a spare pico
To convert a Pico into a debug probe, a matching firmware needs to be installed. The firmware is available 🌐online from the official repository. Select the correct .uf2 file depending on the evaluation board that you use. Use the debugprobe_on_pico.uf2 if you run a Pico using the RP2040 chip. Use debugprobe_on_pico2.uf2 for the Pico2 board based on the RP2350 chip. Install the firmware by setting the Pico into boot mode and copy the firmware file. Same process as with any other firmware.
After programming, the debug interface is present on GP2 (SWCLK) and GP3 (SWDIO) and an additional serial interface is available on GP4 (UART TX) and GP5 (UART RX).
Getting the computer ready
After installing the firmware, the Pico should be recognized as a new USB device. You can check that with the shell command
lsusbThere should be an entry containing ID 2e8a:000c Raspberry Pi Debug Probe (CMSIS-DAP).
Now you need to install the debug server program. I found instruction on 🌐https://github.com/thucon/rpi-pico-debug and in 🌐Getting Started with Raspberry Pi Pico-series
I had to merge them to get the build process to work on my computer.
sudo apt install automake autoconf build-essential texinfo libtool libftdi-dev libusb-1.0-0-dev pkg-configIn addition, I had to install a missing packet, which is now required
sudo apt-get install pkg-config libjim-devThe program can be downloaded, compiled, and installed with the following lines of code:
git clone https://github.com/raspberrypi/openocd.git --branch sdk-2.3.0
cd openocd
./bootstrap
./configure --disable-werror
make -j4
sudo make install
Connect the debugger with the target
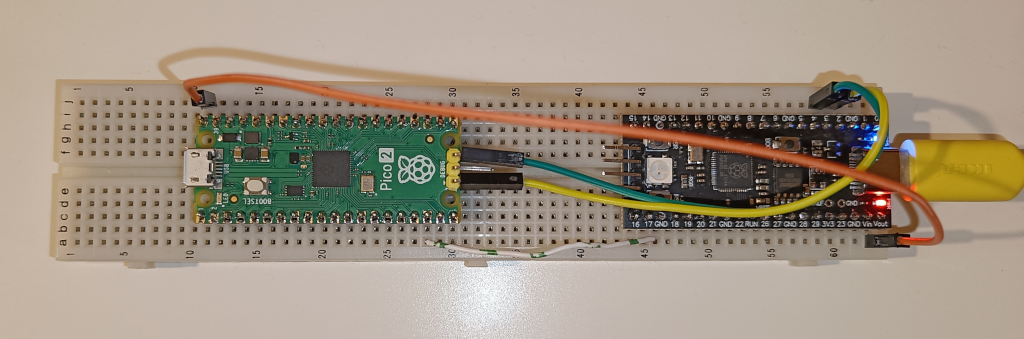
Connect the GP2 (SWCLK) and GP3 (SWDIO) of the debugger with SWCLK (yellow) and the SWDIO (green) of the dedicated debug port of the target IC. Keep in mind the ground (GND) connection between both boards. Any GND pin can be used. The debugger can also be used to power the target if there is no other power source available. This is done with the orange jumper cable. The debugger is connected by USB to the computer.
Better circuit diagrams are shown in 🌐Getting Started with Raspberry Pi Pico-series.
Starting the debug server for the first time
To start OpenOCD as the debug server, use the following command.
sudo openocd -f interface/cmsis-dap.cfg -f target/rp2350.cfg -c "adapter speed 5000"Use target/rp2040.cfg for a Pico and target/rp2350.cfg for a Pico2. If there is no target connected, the command will fail after a timeout.
This program will run and block the terminal. It will also open a server on localhost that other applications (like VS Code) can connect to. To end the program, use Ctrl + X to end the program.
To get additional information for identifying problems, you can use a more informative debug flag (-d3).
sudo openocd -d3 -f interface/cmsis-dap.cfg -f target/rp2350.cfg -c "adapter speed 5000"On 🌐https://github.com/thucon/rpi-pico-debug it is described how to run the software without superuser privileges by creating a udev rule.
Create a new text file
sudo nano /etc/udev/rules.d/60-openocd-picoprobe.rulesand write to that file
ATTRS{idVendor}=="2e8a", ATTRS{idProduct}=="000c", MODE="660", GROUP="plugdev", TAG+="uaccess"Install a debug console and connect it to the server
Depending on the system, you either use gdb or gdb-multiarch. For me gdb-multiarch was the right program.
sudo apt install gdbor
sudo apt install gdb-multiarchFrom a new terminal window, you can have a debugging session while the debugging server is still running. You can use, for example, a blink.elf file that is part of the example codes. The debugging session can be started from within the /build folder by running the command:
gdb blink.elfor
gdb-multiarch blink.elfI did not dig further into how to use that program, but it might come handy to see if the debug server is working as expected.
Debugging from VS Code
Debugging from VS Code works for me without further adjustments. Just the debugging server needs to run. Then the debugging mode can be selected from the user interface. Just make sure that the external OpenOCD option is selected.
